Adoption and Adaptation: Making Technology work for us

The following is reasonably close to a transcription of my keynote at the JIBS meeting titled “Technology will not defeat us: offering a great service in difficult times” on 26th February 2015. The accompanying slides are available:


I want to start by telling you a story which is used by zoo keepers to illustrate the intelligence of various primates. The story focuses on how Gorillas, Bonobos, Chimpanzees and Orangutans react to a specific piece of technology. Before we start, bearing in mind the theme of today’s meeting, I’m going to ask a question – which of these do you think is going to be defeated by the technology?

  • Gorillas
  • Bonobos
  • Chimpanzees
  • Orangutans

The piece of technology in question is a screwdriver left on the floor of a cage.

Gorillas will not notice the screwdriver until they step on it. They will then treat it with caution until they are sure it is harmless. Once they feel safe, they will try to eat the screwdriver, and finding it less than tasty, they will throw it away.

Bonobos will notice the screwdriver immediately, pick it up, inspect it, pass it around and will be so excited by the screwdriver they will work themselves up into an erotic frenzy, during which time the screwdriver will be forgotten.

Chimpanzees will also notice the screwdriver straight away, and immediately start trying it out as a club, a spear, a lever, a hammer, and every other basic tool you can think of – but not as a screwdriver.

As with the Chimpanzees and Bonobos, Orangutans will notice the screwdriver immediately, but will deliberately ignore it to ensure the keeper doesn’t notice them noticing. They will try to take the screwdriver while the keeper isn’t looking. If they get caught, they’ll then try to trade the screwdriver for food. If they manage to grab the screwdriver unnoticed, they’ll wait until nightfall, and then use the screwdriver the dismantle the cage and escape.

Which of the four species was defeated by the technology? They all got different things out of their interaction with technology (in the form of a screwdriver) but were any of them defeated?

This morning I’m going to argue that it is impossible for us as humans and librarians to be defeated by technolgy, but that in order exploit the technology available to us we need to work out which tools we should adopt, and develop the skills needed to adapt those tools to our needs.

We are inseparable from the technology we use

Firstly I want to argue that we are inseparable from the technology we use.

Coevolution is a term used to describe a situation where two things evolve in a symbiotic way. An example is the evolution of plants and pollenating insects. Sometime in the Cretaceous period, flowers began to change – evolving colours and scents – which attracted insects. Simultaneously the insects evolved mechanisms to detect the colours and fragrances. The relationship between these plants and insects continued to evolve and become more sophisticated, until now they are completely dependent on each other.

Humans have a longstanding relationship with technology. Several theories relating to the evolutionary success of humans relate to the use of technology. It seems likely that the ability to make use of fire to cook food that enabled our ancestors to develop larger, better, brains and that the ability to make clothes that meant early humans could migrate out of Africa and live in cooler climates.

Humans have used technology as part of their evolutionary strategy. Rather than relying purely on biological change, we have have developed tools and technology to enable us to survive and thrive in a wide range of environments. We have coevolved with our tools and technology and as with the co-dependence of flowers and insects, we have become dependent on the technologies we use.

It could be argued that our dependence on technology is one way in which it can defeat us. At least as far back as ancient Greece people have been worrying about this. In one of Plato’s Socratic dialogues, Socrates expresses a concern that written text would “create forgetfulness in the learners souls”.

Equally over the last 50 years people have worried about the loss of basic arithmetic skills through the use of calculators, the loss of map reading skills through the use of SatNav, the loss of the ability to read long form text due to Twitter and the loss of basic research skills because of Google.

However, I’m going to defer to Ernst Kapp, a 19th Century Philosopher, who argued that technology is an extension of ourselves. This being the case we can no more be defeated by our over dependence on technology than we can by our over dependence on our arms or legs.

(I recommend the BBC Radio production A History of Ideas: How Has Technology Changed Us? for more on our relationship with technology)

Adopting and adapting technology

Secondly I want to argue that ultimately technology is only adopted if it is needed and thirdly we adapt technology to suit our needs.

A desire path is a path formed by people taking the route they want to travel rather than the one laid down for them by someone else. When faced with technology we don’t just blindly accept what is put in front of us. We will use it if we need it, and modify it to suit our needs

What is the connection between the invention of the printing press in the mid-15th century and the discovery of the cell in the mid-17th Century?

The link between these seemingly unconnected events is described by Steven Johnson in his book “How we got to now”. The magnifying properties of glass are be easily observed, and in the 12th Century chunks of glass were being used by monks to magnify texts as they read, and spectacles were probably invented sometime in the 12th or 13th Century. However, it wasn’t until the invention of the printing press and the subsequent rise in literacy that the need for spectacles became widespread.

As expertise in making lenses spread to meet the demand for reading glasses, people were able to experiment, leading to the invention of the microscope, and so to the discovery of the cell by Robert Hooke.

I like this story because it demonstrates that just because a technology exists doesn’t mean we will adopt it, and just because a tool is designed for a specific purpose doesn’t mean it will always get used in that particular way – people will adapt it to their own needs – and it is when this happens we see the most powerful use of technology.

The example of the lense is a particularly striking example of adoption followed by adaptation, but all tools and technologies are potentially subject to this pattern. The first tablet computers were designed for “road warriors” – business people who were on the move. Now we know the reason we need tablet computers is to be able to play Candy Crush.

Twitter was invented as a way of sending short updates about your life to your friends. People almost immediately started adapting Twitter with the invention of the hashtag and the retweet – these concepts were eventually folded back into the tool, which has become a worldwide realtime communication platform used for everything from news reporting to connecting celebrities and their fans to writing literature to building and supporting communities.

Going back to our primates, while the Gorillas and Bonobos fail to adopt technologies either through disinterest or lack of focus, the Chimpanzees and Orangutans both adopt the technology they have to hand, but they adapt it in different ways.

Our ability to adapt technologies to our own purposes depends on both the nature of the technology and the skills we possess. It took a company with a charismatic leader and world leading design and technical teams to move us from the first iterations of the tablet computer to the iPad. On the otherhand it took one person and under 140 characters to invent the hashtag.

Library Carpentry

What then are the right skills for librarians and libraries to enable them to choose and exploit the right tools and technologies?

I’m currently training as an instructor for something called “Software Carpentry”. Software Carpentry is an organization with the goal of teaching scientists basic computing skills. The reason Software Carpentry exists is because computing is now integral to doing science, but most scientists are never taught how to build and use software effectivley.

Software Carpentry teaches a range of skills and tools focussed around four topics:

  • automating tasks
  • structured programming
  • version control
  • data management

Data Carpentry is a related organisation which focusses specifically on skills and tools for working effectively with data. Data Carpentry teaches:

  • How to use spreadsheet programs more effectively, and the limitations of such programs.
  • Getting data out of spreadsheets and into more powerful tools
  • Using databases, including managing and querying data
  • Workflows and automating repetitive tasks

At a recent THATCamp – a series of unconferences focussing on the use of technology in the Humanities I participated in a discussion that identified a similar set of tools and skills that were needed for students and researchers working in the growing area of Digital Humanities .

While Software Carpentry workshops are specifically aimed at scientists, they’ve also proved popular with librarians, and last year there were at least three Software Carpentry workshops specifically for librarians. James Baker, a Curator in the Digital Research team at the British Library and Software Sustainability Institute Fellow has recently asked the question “what would Library Carpentry look like?”

This is my first attempt at an answer to this question.

Data

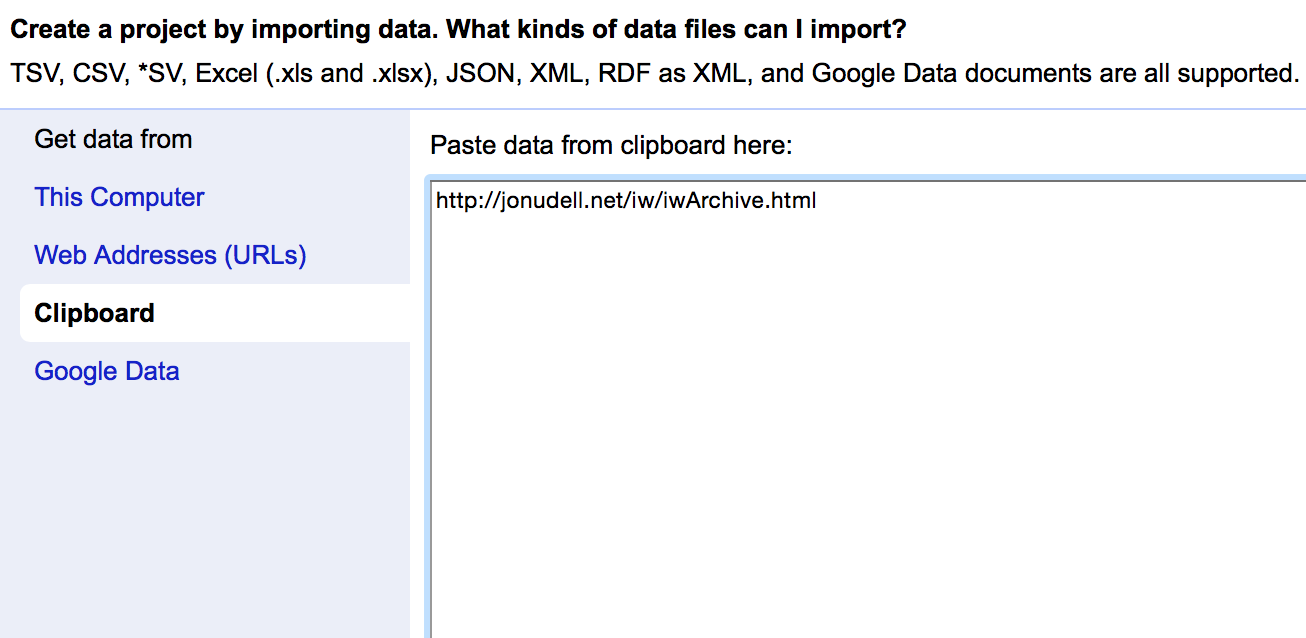
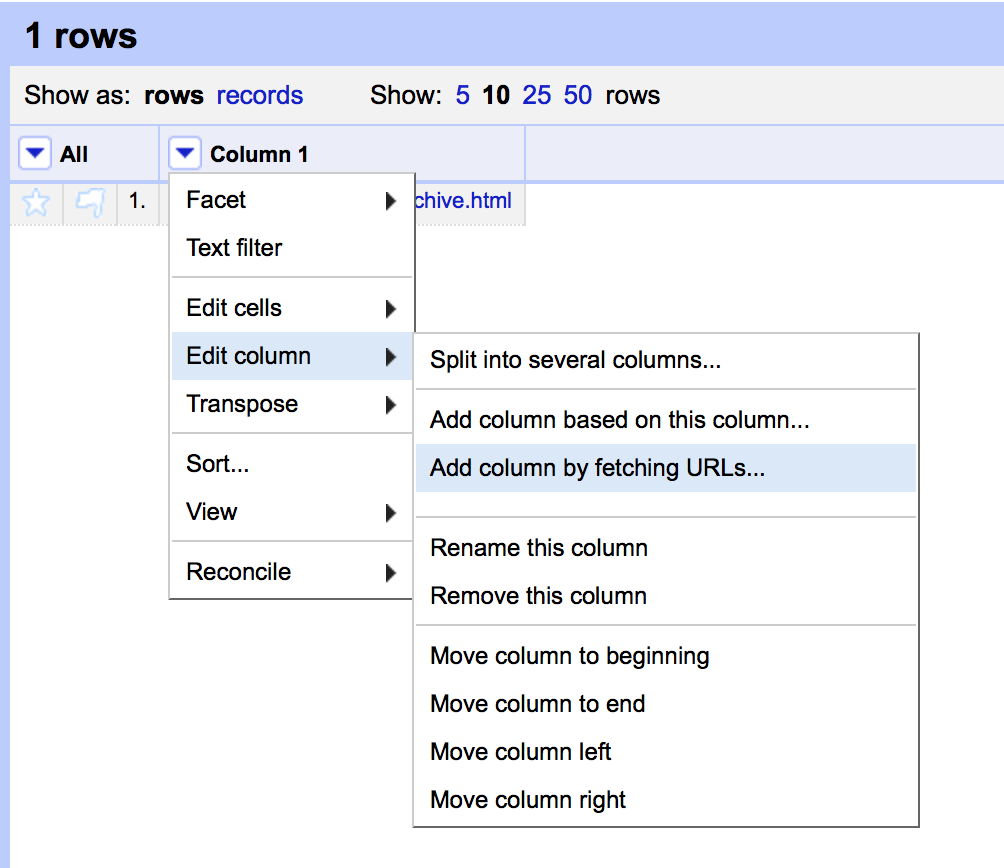
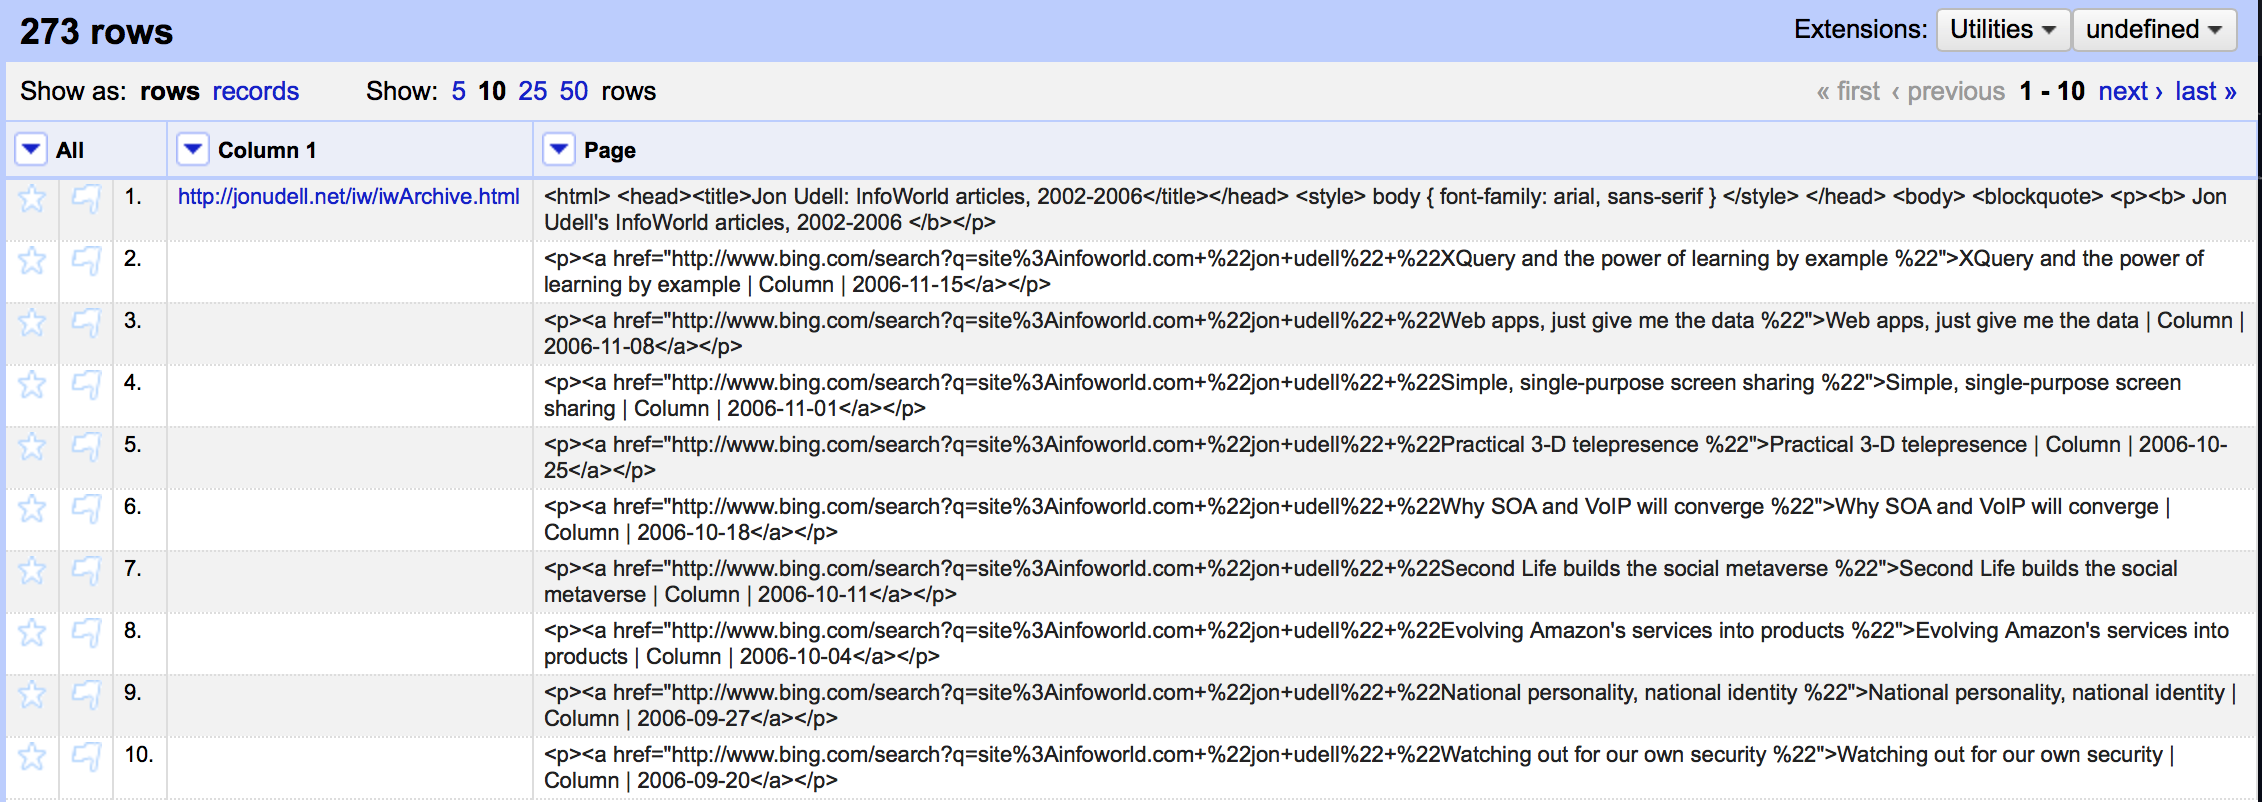
There is a large overlap with the Data Carpentry syllabus here. We deal with data everyday, and we need to make sure we are taking advantage of all the tools available to us – we don’t want to be the gorillas ignoring the opportunities in front of us. We should be as comfortable with setting up databases as we are with setting up spreadsheets. We should take advantage of tools like Open Refine which can help understand and manipulate large data sets. I deliver a course on using OpenRefine for the British Library and the materials are available under a CC-BY licence. The GOKb project, which is building a global and open knowledgebase of electronic resources used in libraries uses OpenRefine to clean publisher and vendor data about resources before loading them into the GOKb database. We should have access to Unix Command Line tools like “grep“, “sort” and “uniq” and know how to use them to manipulate data.

Automation

Automating processes where possible allows us to spend less time on mundane tasks. There are a huge range of tools available that can help with this – from web based tools like “If This, Then That“(recently rebranded to “If” and “Do”) which allows you to trigger actions on the web or on smart phones, when certain conditions occur, to tools like MacroExpress which allows you to automate all kinds of tasks in Windows.

At the Pi and Mash event last year I ran a workshop on tools you could use to automate processes – from setting up keyboard shortcuts for common functions (e.g. typing in the address of the library) to automating searching for ISBNs on WorldCat (you can work through the examples from the Automated Love workshop handout)

There are many more opportunities for automation. One of the things that first got me into systems librarianship was when I was a trainee in the Library at Arjo Wiggins and had to automate processes (as so often is the case, this was in reaction to a decrease in staff) to find articles relevant to paper making and compile them into a current awareness bulletin.

The web

The web is clearly key to our work of connecting people with relevant information. We need to not only know how to find information on the web, but also the technical underpinnings, the mechanisms for publishing data on the web and consuming data from the web in our own systems and services.

This is about exploiting the web and making sure our resources are part of the web. Integrating our resources into the web by getting them into existing popular web sites like Wikipedia, YouTube and Flickr, and publishing data and resources on the web in formats that exploit the nature of the web.

Library Systems

Much of the work we do is based on specialist library systems, often provided by a vendor. We may not have many options to change how these work but we should understand how they work, how far they can be modified, and also understand what the alternatives are – especially open source alternatives (e.g. Zotero, Umlaut, Blacklight, VuFind) and the pros and cons of using them. These tools can work at a desktop level for library staff as well as a user facing level.

Code?

In the previous four areas I’ve avoided suggesting that we need to be able to write code to be able to effectively exploit technology. However, in all of these areas I believe that being able to code would help. In a blog post in 2012 Andromeda Yelton, who now teaches helps librarians to learn to code, outlined four reasons why she believed librarians should learn to code. These were:

  • Optimizing workflows
  • Improving usability
  • Communicating with IT and vendors
  • Insight, dreaming, and creation

Do we all need to go back and do this? No. As with the four primates, technology cannot defeat us, no matter how we use it. But if we don’t develop the relevant skills we cannot hope to get the most out of the technology available to us. We risk being like Gorillas – ignoring technology because we don’t understand what it can do for us; Or like Bonobos – excited by the novel but not able to turn that excitement into practical applications; Or like Chimpanzees – able to use technology, but not always in the most appropriate way.

The thing is, as anyone who has read Terry Pratchett knows, orangutans make the best librarians. Let’s be orangutans.

(Thank you)

Acknowledgments

The content in this talk was drawn from a range of sources but I’d like to particularly acknowledge:

Talking about Tools

This week I attended a THATCamp organised by the British Library Labs . THATCamp is a series of unconferences focussing on the Humanities and Technology.

I’ve been thinking a lot about the tools available to us in libraries and in the digital humanities recently. I’ve delivered training on OpenRefine and been following how it is being used. I’ve started training to become a Software Carpentry instructor. I’ve been following James Baker’s research in progress around the British Museum Catalogue of Satires, where he has documented his use of SPARQL, OpenRefine and AntConc. Finally as part of my preparation for an upcoming keynote for JIBS I’ve been reading about tools and technology and their importance to the development of homo sapiens and our modern society.

This may explain why, when I pitched a session for THATCamp, it ended up being about the tools being used by people working in the Digital Humanities.

What I pitched was a simple ‘show and tell’ session with an opportunity for attendees to say something about tools they’d found helpful (or unhelpful). I kicked off talking about OpenRefine and others talked about tools they’d used including Gephi, TileMill, AntConc, Juxta, as well as a mention of the DiRT Directory which provides an annotated list of digital research tools for scholarly use. As far as I was able to I tried to capture the details of the tools we discussed in the Etherpad for the event.

However, the discussion of specific tools turned out to be the least interesting part of the session, as thanks to the other participants discussion veered off into some different areas. By its nature and due to the number of participants the discussion wasn’t very focussed, and I’m not sure we drew any hard conclusions, but reflecting on it now I feel there were two overlapping strands to the discussion.

The first strand of the discussion was the question of having the knowledge and skills to use tools both appropriately and effectively. A couple of the participants who were teaching in the digital humanities noted how students didn’t necessarily have even the basic skills needed for the field.

Some of the skills covered were very basic – down to touchtyping and general keyboard skills (e.g. knowing and using simple keyboard shortcuts like Ctrl+C and Ctrl+V for cut and paste) to work more effectively. Some were more specialist computing skills (like programming and writing SQL), and some were more general skills that are needed in many disciplines (like statistics and algebra).

The first category of skills are needed just to get stuff done – although you might be able to get by without them, you’ll be less effective. This reminded me of the post on “command-line bullshittery” by Philip Guo .

The second category of skills are ones that you might not become expert but you want some level of competency (this very much echoes the aims of Software Carpentry – to get people to the level of competence, not to the level of expert). Have competence in these skills means you can use them yourself, but perhaps just as importantly, you know enough to be able to talk to experts about what you need and work with them to get appropriate software or queries written to serve your needs.

The third category of skills are perhaps ones that are core to (at least some aspects of) the digital humanities, and some of them are necessary to be able to apply tools sensibly. In this last area visualisation tools like Gephi and Tableau in particular came under discussion as being easy to apply in an inappropriate or unthinking way.

This last point is where the discussion of skills overlapped with the second strand of the discussion (as I saw it) which was the aesthetics of the tools. The way in which Gephi and Tableau make it easy to create beautiful looking visualisations gives them a plausible beauty – and what you produce has the feel of a finished product, rather than the output of a tool which requires further consideration, contextualisation and analysis.

On the otherhand tools like OpenRefine and AntConc are not pretty. They are perhaps more obvious with their mechanics and the outputs are more obviously in need of further work. They have ugly utility.

Another comment on the aesthetics of the tools was that some of the tools were ‘dull’ – this was specifically levelled at the command-line. I’m intrigued by the idea that some tools are less engaging than others. I’m also aware that apply aesthetic judgements to tools that I use – the example I gave in the discussion was feeling that Ruby was a more attractive programming language than Javascript.

It struck me during the discussion that the tools we have are (in general) designed by a small section of society – and perhaps favour particular methods and aesthetics. I wonder if there are other approaches to such tools that would favour different aesthetic sensibilities. This maybe a flight of fancy on my part 🙂

Finally the discussion finished with a reflection that much of the time the tools that already exist do almost, but not quite, what you want to do. I’m currently reading “How we got to Now” by Steve Johnson, recommended to me by @copystar. In the book Johnson relates how Charles Vernon Boys wanted to create a balance arm for a device to measure the effects of delicate physical forces on objects. In an attempt to create a very thin glass shard to use as the balance arm, Boys used a crossbow to fire bolts attached to molten glass across his lab – leaving trails of glass behind them – and so glass fibre was invented. While relating this story Johnson writes “New ways of measuring almost always imply new ways of making.” Perhaps we are in need new ways of both making and measuring for the humanities?

Using OpenRefine to manipulate HTML

Jon Udell wrote a post yesterday “Where’s the IFTTT for repetitive manual text transformation?“. In the post Jon describes how he wanted to update some links on one of his web pages and documents the steps needed to do the update to all links in a systematic way. Jon notes:

Now that I’ve written all this down, I’ll admit it looks daunting, and doesn’t really qualify as a “no coding required” solution. It is a kind of coding, to be sure. But this kind of coding doesn’t involve a programming language. Instead you work out how to do things interactively, and then capture and replay those interactions.

and then asks

Are there tools – preferably online tools – that make this kind of text transformation widely available? If not, there’s an opportunity to create one. What IFTTT is doing for manual integration of web services is something that could also be done for manual transformation of text.

While I don’t think it is completely the solution (and agree with Jon there is a gap in the market here) I think OpenRefine (http://openrefine.org) offers some of what Jon is looking for. Generally OpenRefine is designed for manipulating tabular data, but in the example Jon gives at least, the data is line based, and sort of tabular if you squint at it hard.

I think OpenRefine hits several of the things Jon is looking for:

  • it lets you build up complex transformations through small steps
  • it allows you to rewind steps as you want
  • it allows you to export a JSON representation of the steps which you can share with others or re-apply to a future project of similarly structured data.

These strengths were behind choosing OpenRefine as part of the data import process in the http://gokb.org project I’m currently working on where data is coming in different formats from a variety of sources, and domain experts, rather than coders, are the people who are trying to get the data in a standard format before adding to the GOKb database.

So having said in a comment on Jon’s blog that I thought OpenRefine might fit the bill in this case, I thought I’d better give it a go – and it makes a nice little tutorial as well I think…

I started by creating a new project via the ‘Clipboard’ method – this allows you to paste data directly into a text box. In this case the only data I wanted to enter was the URL of Jon’s page (http://jonudell.net/iw/iwArchive.html)

Screen Shot 2014-12-17 at 09.17.52
I then used the option to ‘Add column by fetching URLs’ to grab the HTML of the page in question

Screen Shot 2014-12-17 at 09.21.36

I now had the HTML in a single cell. At this point I suspect there are quite a few different routes to getting the desired result – I’ve gone for something that I think breaks down into sensible steps without any single step getting overly complicated.

Firstly I used the ‘split’ command to break the HTML into sections with one ‘link’ per section:

value.split("<p><a href").join("~<p><a href")

All this does is essentially add in the “~” character between each link.

I then used the ‘Split multi-valued cells’ command to break the HTML down into lines in OpenRefine – one line per link:

Screen Shot 2014-12-17 at 09.27.17
The structure of the links is much easier to see now this is not a single block of HTML. Note that the first cell contains all the HTML &gt;head&lt; and the stuff at the top of the page. If we want to recreate the original page again later we are going to have to join this back up again with the HTML that makes up the links so I’m going to preserve this. Equally at this stage the last cell in the table contains the final link AND the end of the HTML:

<p><a href="http://www.bing.com/search?q=site%3Ainfoworld.com+%22jon+udell%22+%22Web services %22">Web services | Analysis | 2002-01-03</a></p>
</blockquote>
</body>
</html>

This is a bit of a pain – there are different ways of solving this, but I went for a simple manual edit to add in a ‘~’ character after the final &gt;/p&gt; tag and then using the ‘split multi-valued cells’ again. This manual step feels a bit messy to me – I’d prefer to have done this in a repeatable way – but it was quick and easy.

Now the links are in their own cells, they are easier to manipulate. I do this in three steps:

  1. First I use a ‘text filter’ on the column looking for cells containing the | character – this avoids applying any transformations to cells that don’t contain the links I need to work with
  2. Secondly I get rid of the HTML markup and find just the text inside the link using: value.parseHtml().select(“a”)[0].innerHtml()
  3. Finally I build the link (to Jon’s specification – see his post) with the longest expression used in this process:
"<p><a href=\"http://www.bing.com/search?q=site%3Ainfoworld.com+%22jon+udell%22+%22"+ value.split("|")[0].trim().escape('url')+"%22\">"+ value + "</a></p>"

Most of this is just adding in template HTML as specified by Jon. The only clever bits are the:

value.split(“|”)[0].trim().escape(‘url’)

This takes advantage of the structure in the text – splitting the text where if finds a | character and using the first bit of text found by this method. It then makes sure there are no leading/trailing spaces (with ‘trim’) and finally uses URL encoding to make sure the resulting URL won’t contain any illegal characters.

Once this is done, the last step is to use the ‘join multi-valued cells’ to put the HTML back into a single HTML page. Then I copied/pasted the HTML and saved it as my updated file.

I suspect Jon might say this still isn’t quite slick enough – and I’d probably agree – but there are some nice aspects including the fact that you could expand this to do several pages at the same time (with a list of URLs at the first step instead of just one URL) and that I end up with JSON I can (with one caveat) use again to apply the same transformation in the future. The caveat is that ‘manual’ edit step – which isn’t repeatable. The JSON is:

[
 {
 "op": "core/column-addition-by-fetching-urls",
 "description": "Create column Page at index 1 by fetching URLs based on column Column 1 using expression grel:value",
 "engineConfig": {
 "facets": [],
 "mode": "row-based"
 },
 "newColumnName": "Page",
 "columnInsertIndex": 1,
 "baseColumnName": "Column 1",
 "urlExpression": "grel:value",
 "onError": "set-to-blank",
 "delay": 5000
 },
 {
 "op": "core/text-transform",
 "description": "Text transform on cells in column Page using expression grel:value.split(\"<p><a href\").join(\"~<p><a href\")",
 "engineConfig": {
 "facets": [],
 "mode": "row-based"
 },
 "columnName": "Page",
 "expression": "grel:value.split(\"<p><a href\").join(\"~<p><a href\")",
 "onError": "keep-original",
 "repeat": false,
 "repeatCount": 10
 },
 {
 "op": "core/multivalued-cell-split",
 "description": "Split multi-valued cells in column Page",
 "columnName": "Page",
 "keyColumnName": "Column 1",
 "separator": "~",
 "mode": "plain"
 },
 {
 "op": "core/multivalued-cell-split",
 "description": "Split multi-valued cells in column Page",
 "columnName": "Page",
 "keyColumnName": "Column 1",
 "separator": "~",
 "mode": "plain"
 },
 {
 "op": "core/text-transform",
 "description": "Text transform on cells in column Page using expression grel:value.parseHtml().select(\"a\")[0].innerHtml()",
 "engineConfig": {
 "facets": [],
 "mode": "row-based"
 },
 "columnName": "Page",
 "expression": "grel:value.parseHtml().select(\"a\")[0].innerHtml()",
 "onError": "keep-original",
 "repeat": false,
 "repeatCount": 10
 },
 {
 "op": "core/text-transform",
 "description": "Text transform on cells in column Page using expression grel:\"<p><a href=\\\"http://www.bing.com/search?q=site%3Ainfoworld.com+%22jon+udell%22+%22\"+ value.split(\"|\")[0].trim().escape('url')+\"%22\\\">\"+ value + \"</a></p>\"",
 "engineConfig": {
 "facets": [
 {
 "query": "|",
 "name": "Page",
 "caseSensitive": false,
 "columnName": "Page",
 "type": "text",
 "mode": "text"
 }
 ],
 "mode": "row-based"
 },
 "columnName": "Page",
 "expression": "grel:\"<p><a href=\\\"http://www.bing.com/search?q=site%3Ainfoworld.com+%22jon+udell%22+%22\"+ value.split(\"|\")[0].trim().escape('url')+\"%22\\\">\"+ value + \"</a></p>\"",
 "onError": "keep-original",
 "repeat": false,
 "repeatCount": 10
 },
 {
 "op": "core/multivalued-cell-join",
 "description": "Join multi-valued cells in column Page",
 "columnName": "Page",
 "keyColumnName": "Column 1",
 "separator": ""
 }
]

Working with Data using OpenRefine

Over the last couple of years, the British Library have been running a set of internal courses on digital skills for librarians. As part of this programme I’ve delivered a course called “Working with Data”, and thought it would be good to share the course structure and materials in case they were helpful to others. The course was designed to run in a 6 hour day, including two 15 minute coffee breaks and a one hour lunch break. The focus of the day is very much using OpenRefine to work with data, with a very brief consideration of other tools and their strengths and weaknesses towards the end of the day.

Participants are asked to bring ‘messy data’ from their own work to the day, and one session focusses on looking at this data with the instructor, working out how OpenRefine, or other tools, might be used to work with the data.

The materials for this course are contained in three documents:

  1. A slide deck: “Working with Data using OpenRefine” (pdf)
  2. A handout: “Introduction to OpenRefine handout CC-BY” (pdf)
  3. A sample date file generated from https://github.com/BL-Labs/imagedirectory/blob/master/book_metadata.json (csv)

The slides contain introductory material, introducing OpenRefine, describing what type of tasks it is good for, and introducing various pieces of functionality. At specific points in the slide deck there is an indication that it is time to do ‘hands-on’ which references exercises in the handout.

The schedule for the day is as follows:

Introduction and Aims for the day (15 mins)

Session 1 (45 mins)

  • Install Open Refine
  • Create your first Open Refine project (using provided data)
  • Basic Refine functions part I
    • Columns and Rows
      • Sorting by columns
      • Re-order columns
    • Using Facets Part I
      • Text facets
      • Custom facets

Break (15 mins)

Session 2 (45 mins)

  • Basic Refine functions part II
    • Refine data types
    • Using Facets Part II
      • Clustering facets
    • Transformations
      • Common transformations
      • Using Undo/Redo
      • Write transformations with ‘GREL’ (Refine Expression Language)

Lunch (60 mins)

Session 3 (60 mins)

  • – What data have you brought along?
    • Size
    • Data
    • How can Refine help?
    • What other tools might you use (e.g. Excel,…)
  • Your data and Refine
    • Can you load your data into Refine
    • Handson plus roaming support

Break (15 mins)

Hour 4 (60 mins)

  • Advanced Refine
    • Look up data online
    • Look up data across Refine projects
    • Refine Extensions and Reconciliation services
  • Handson plus roaming support

Round-up (15 mins)

The materials linked above were developed by me (Owen Stephens, owen@ostephens.com) on behalf of the British Library. Unless otherwise stated, all images, audio or video content included in these materials are separate works with their own licence, and should not be assumed to be CC-BY in their own right.

The materials are licensed under a Creative Commons Attribution 4.0 International License http://creativecommons.org/licenses/by/4.0/. It is suggested when crediting this work, you include the phrase Developed by Owen Stephens on behalf of the British Library.

Linked Data for Libraries: Publishing and Using Linked Data

Today I’m speaking at the “Linked Data for Libraries” event organised and hosted by the Library Association of Ireland, Cataloguing & Metadata Group; the Digital Repository of Ireland; and Trinity College Library, Dublin. In the presentation I cover some of the key issues around publishing and consuming linked data, using library based examples.

My slides plus speaker notes are available for download – Publishing and Using Linked Data (pdf).

Lessons from the Labs

This blog post was written during a presentation at the British Library Labs Symposium in November 2014. It is likely full of errors and omissions having been written real-time.

Adam Farquhar, Principal Investigator of the British Library Labs project

In summer 2014 BL ran a survey to improve understanding of digital research behaviour. Around 1600 particpants, 57% femail, 50% academic inc. 32% postgraduates. Nearly 75% were registered readers at the BL. 58% from Arts & Humanities, 21.5% Social Sciences, 13.1% STM. 42.4% from London and a further 35% from other parts of the UK.

92% would recommend the library and 82% said the Library plays an important role in digital research – which was 3 times more than the result for the same question in 2011.

63% of users are satisfied with BL digital services – remote access to more BL electronic resource, the option to view BL digital content on personal devices could improve this.

Some things not changing – perhaps against expectations. Most readers work alone still but using social media more than previously.

1 in 6 respondents were using programming in their research.

Digital collection at BL has been growing rapidly – now around 9million items (huge jump in 2012 from under 2 million to almost 7 million). But remember a book counts as one item – even if many images and pages made available separately, and an ‘item’ in the web archive is a WARC file that can contain many thousands of websites. Looking at size of content in gigabytes the growth is more linear.

The Digital Collections are extremely varied – datasets, images, manuscripts, maps, sounds, newspapers, multimedia, books and text, web archive, journal articles, e-theses, music, playbills.

Lessons from work so far

  • Lesson 1: More is more
    • it’s about digital content – without this you can’t do digital scholarship. Getting the digital content is “bloody hard work”
    • digital deposit coming and will be the basis for the national digital collection in years to come – but not a panacea
    • partnerships – e.g. DC Thomson for further Newspaper digitisation
    • partnership with Google to digitise around 250k works
  • Lesson 2: Less is more
    • Delivering a single ‘perfect’ system won’t be perfect for everyone
    • Deliver people more systems that give more access to more content
  • Lesson 3: Bring your own tools
    • People want to bring their own tools with them – need to enable this to happen
  • Lesson 4: Be creative
    • Let people be creative with the content
  • Lesson 5: Start small – finish big
    • Easy to start with small things – 5 books, 50 books – do this before trying to work with larger collections

Conclusions
* Researchers are embracing digital technology and methods
* Digital collections with unique content are large enought to support research – with some caveats
* Library staff need training to keep pace with change
* Open engagement fits ermeging practice
* Radical re-tooling is needed to support researcher demands…
* … but existing technology provides what we need

Visibility: Measuring the value of public domain data

This blog post was written during a presentation at the British Library Labs Symposium in November 2014. It is likely full of errors and omissions having been written real-time.

Peter Balman, software developer

“Visibility” is a project, funded by money from the ‘IC Tomorrow’ (BL and TSB initiative) v important to institutions like the BL who are releasing data publicly and want to understand the value and impact of doing this

The challenge:
“This challenge is to encourage and establish the necessary feedback to measure the use and impact o f public-domain content”

Looking at the BL release of images under CC0 licence on Flickr. What is the value? what is the ROI?

What can we look at?
* How often is an image used
* What are the demographics of those using the images
* What do people talk about when they use images or refer to images from the collection

Where to start?
BL know anecdotally of re-use, but no knowledge about which images being used, and what proportion of collection being used?
The ‘journey’ of an image in the collection isn’t a linear narrative – it is a tree branching off in different directions.

Approaches:
* Take small section of collection and examine in depth
* Look at all million images and crunch the data

Peter aiming to build an application where you can look at an image, and look at information about how it is being used, mentioned etc., and finally promote images in terms of how they’ve been used.

For each image:
* Search web for the image (e.g. with Tineye, Image Raider)
* Natural language processing on the related page looking for context
* Once you have data what do you do? Organisation of data into categories as per the LATCH theory (time, category, place)

Product ready and starting to crunch data, looking for more institutions to test the tool.

Digital Music Lab: Analysing Big Music Data

This blog post was written during a presentation at the British Library Labs Symposium in November 2014. It is likely full of errors and omissions having been written real-time.

Adam Tovell, Digital Music Curator, British Library & Daniel Wolff, City University

Goal is to develop research methods and s/w infrastructure for exploring and analysing large-scale music collection & provide researchers and users with datasets and computational tool to analyse music audio, scores and metadata.

  • Develop and evaluate music research methods for big data
  • Develop and infrastructure (technical, insitutional, legal) for large-scale music analysis
  • Develop tools for larg-scale computational musicology
  • Use and produce Big Music Data sets

It is possible to use software to analyse aspects of a musical recording. For example looking at:
* Visualisation
* Timings
* Intonation
* Dynamics
* Chord progressions
* Melody

Derived data from s/w analysis can be used to inform research questions.

So far these approaches have been applied to small amounts of music

Field of Music Information Retrieval apply the same techniques to larger bodies of music. These kinds of approaches are behind things like some music recommendation services.

To bring together MIR techniques with musicology academic research approaches need a large body of recorded music – which is where the BL music collection comes in – enabling Large-scale Musicology. BL has over 400 different recording of Chopin’s Nocturne in E-flat major op.9, no.2 – you can ask questions like:
* how has performance changed over time?
* do performers influence each other?
* does place affect performance?
* etc.

BL music collections have over 3 million unique recordings covering a very wide range of genres – popular, traditional, classical, with detailed metadata and a legal framework for making them available to people – sometimes online, and sometimes on-site.

Musicological Questions
* Automatic analysis of scores
* structural analysis from audio
* analysing styles & trends over time
* new similarity metrics (e.g. performance based)
* …

Data sets currently being used:
* British Library – currently curating available music data collections from BL sound archive (currently done around 40k recordings)
* CHARM – 5000 copyright-free recordings + metadata
* ILikeMusic – commercial music library of 1.2M tracks

Analysis results so far:
* ILikeMusic – chord detection
* CHARM – instrumentation analysis
* MIDI-scal transcription
* High-res transcription (create scores from recording)
* BL – key detection, + more

Visualisations – available at http://dml.city.ac.uk

Automatic Tagging – e.g. genre, style, period. To expensive to tag large datasets, automated classification challenging especially without ‘ground truth’.

Palimpsest: An Edinburgh Literary Cityscape

This blog post was written during a presentation at the British Library Labs Symposium in November 2014. It is likely full of errors and omissions having been written real-time.

Dr Beatrice Alex, University of Edinburgh

Looking for mentions of places in Edinburgh using data sources including:
* HathiTrust
* British Library Nineteenth Century Books Collection (main source)
* Project Gutenberg
* Oxford Text Archive data

Interested in using EEBO/ECCO

Workflow:
* Digitised documents from collections above
* Document retrieveal and filtering -> to get ranked lists of Edinburgh specific candidates
* Manual curation – curation of Edinburgh specific literature – need a human in the loop to get the level of detail they desired
* Text minimg – fine-grained location extraction and geo-referencing using the Edinburgh Geoparser
* All data stored in database that then powers the visualisations etc.

Big data IN -> Small data OUT

All input documents must first be:
* Converted to a common format
* Identified as written English text
* Post-corrected automatically if necesssary
* Linguistic pre-processing

  • Document retrieval. The goal is to find all Edinburgh loco-specific items which fit our remit (fiction, autobio, travel)
  • Get ranked dcouments
  • Assisted Curation is done with Palimpsest Annotation Tool (developed at St Andrew’s). Human makes decisions about whether items are ‘in or out’ (e.g. poetry marked as such and then excluded for the moment – may come back to this later)

Gazetteer Creation
* Text minign tools use the Edinburgh Geoparser to mark-up place names and resolve them to coordinates with a choice of gazetteer as the reference source – e.g. Geonames

Not all place matches in the gazetteer are interesting to the project – e.g. ‘Spring’. Clean these out. Have built the gazetteer and now building on this – e.g. want to do further linguistic analysis, building a mobile app so you can explore the literature based on your location

Final outputs will be web-based visualisations and a mobile app – the aim is to create interfaces for both literary scholars and the general public.

Victorian Meme Machine

This blog post was written during a presentation at the British Library Labs Symposium in November 2014. It is likely full of errors and omissions having been written real-time

Bob Nicholson from Edge Hill.

Victorian’s not associated with humour – “We are not amused”. But jokes were everywhere in Victorian culture – perhaps forgotten or downplayed – you can quote from the great Victorian literature, but what is your favourite Victorian joke?

Jokes reveal lost of things – slang etc. Were an area of existing research for Bob.

Initial Idea:
* Find way of extracting jokes from newspapers
* Start marking up jokes with metadata/semantic tagging
* Try to find suitable image from the BLs image collection
* Overlay text on a suitable image to push out to social media

Issues:
* Where to look?
* Books – e.g. “Book of Humour, Wit and Wisdom” – a joke book. Manually extracted these
* Newspapers – many had weekly joke columns – e.g. 20 jokes per week over many years – thousands of jokes
* Existing markup breaks newspapers down to columns
* But difficult to get access to the source data in appropriate format
* Have manually downloaded and extracted for now
* OCR/Transcription
* Poor OCR not good enough for re-publishing the jokes
* Need to use manual transcription
* Using Omeka to provide transcription platform (using ‘Scripto’)
* Quicker to type up text than markup broken OCR
* Simple xml markup j = joke, t = title, a= attribution
* Want to go further – mark up names, dialogue
* Publishing Jokes
* Original idea of putting speech bubbles on pictures extremely challenging
* Instead putting jokes next to image of person – as if they are telling the joke
* Looking for images that can be used in this way
* Would also like to find images that would work for dialogue style jokes
* Ideally would like to be able to use images which somehow add to the narrative of the joke

What Next?

Coming soon “The Mechanical Comedian” – will tweet a joke each day
http://www.victorianhumour.tumblr.com
@victorianhumour

Eventually will publish database of jokes at http://victorianhumour.com

Will start inviting users to re-interpret jokes – trying to make terrible jokes funny again

All tools used in the project have been free and open source. Allows you to get started cheaply.
Next:
* Seek external funding & new partnerships
* Expand and automate joke extraction
* Implement a new transcription platform
* Develop an accessible online database of jokes

Big picture

Repurposing – difficult to use the digitised versions of newspapers
Remixing – bringing together disparate elements
Gamification – new ways of engaging people with the material
Labs – has allowed Bob to bring an idea and to start experimenting

To follow
www.digitalvictorianist.com
@digivictorian